
Analysis: Looking at one of the most important decisions an investor can make.
We’ve written about strategic asset allocation previously – the investment science behind the long- term allocation of investors’ capital across various asset classes. In our view, strategic asset allocation (SAA) is one of, if not the most important decision an investor can make when developing a portfolio of investments.
The logic surrounding SAA is straightforward; a rigorous observation of an asset class’s historical performance overlaid with some contemporary assumptions about future performance in order to approximate an investment mix that best matches an investor’s return and risk expectations.
But investing isn’t simple and expected returns are an average of historical returns, with all the ups and downs in-between. Prices of financial assets don’t typically move in a straight line!
Strategic versus Tactical Allocation
Strategic asset allocations are reasonably enduring, ideally set for somewhere between five years to a decade and potentially lasting as long as a generation, on the understanding that intra-period reviews are carefully considered and undertaken to ensure a fit-for-purpose SAA.
Tactical asset allocation, or the short-term deviation of the investment mix away from the longer-term SAA, is an approach active investment managers use to navigate through the ups and downs of financial asset prices.
The logic of tactical asset allocation decision-making is about responding to opportunities, the known and unknown, either good or bad. The intention being to generate higher returns in favourable markets teamed with the aspiration to limit or mitigate losses when markets turn negative.
Most investors know that economic activity is cyclical, but how does an investment manager know that one stage of the economic cycle has been completed and that the next phase has begun? And by definition, who knows when the unexpected will actually happen?
Timing the market
What we do know is that markets, like the athletes at last month’s Paris Olympics, get fatigued. And when that happens they’re usually vulnerable to a correction.
Or think about sports’ betting. The first All Black’s versus Puma’s test match of this season had our local betting agency offering a $7.00 return for the Argentineans to win.
Who knew if the Argentineans would do the job or not? In the end they most certainly did, but the odds offered were based on old data about both the ABs and Argentina. The potential financial return - at $7 pay out on a $1 bet when there were only two teams competing - was very appealing and merited consideration.
The local punter most likely relies on a gut feeling prior to making a wager, but an investment manager should take a more empirical approach to short-term investment decision-making.
Earlier this month, who knew that the Reserve Bank of New Zealand (RBNZ) would officially signal the conclusion to its multi-year tightening of monetary policy with a 0.25% cut to the Official Cash Rate (OCR)?
While we’re guessing that most investors had a tactical asset allocation over-exposure to domestic fixed interest, we’re not sure if there was market consensus as to when the RBNZ would begin easing monetary policy?
Indeed, many market observers thought the RBNZ would start in August, and even more hoped that they would, but a lot of market commentators didn’t think they would move as quickly as they did. This uncertainty creates risk, and therefore opportunity, for reward.
Using the New Zealand Government 10-year bond (the “benchmark”) as a general proxy for domestic wholesale interest rates and bond yields, an ill-informed investor may not realise that most of the super normal profits usually associated with a sustained fall in the OCR may have already be taken, in the immediate short term, at least.
Here, we reference the performance of the Bloomberg NZBond Composite 0+ Yr Index, a core New Zealand fixed interest market index. For the 12 months to 13 August 2024 the index has delivered a super-normal gross return (pre fees and tax) of 9.05%. An astonishing return for a core, go-to, domestic fixed interest strategy, especially when considering that this was the annual return up to the day before the RBNZ announcement!
Undertaking technical analysis
Let’s take a look at what the statistics are saying about the 10- year benchmark’s yield action. Here investors could rely on the deviation of the yield from its moving average by observing Bollinger bands. Typically favouring a difference in these two metrics of two standard deviations, the more proactive investor could then collaborate signals from the Bollinger bands with other return data in order to satisfy themselves that they’re getting enough information, so as to form a more accurate view of the structure and integrity of the 10-year benchmark’s returns.
Without getting too much into the technical details, momentum is a measure of the price or yield ups and downs while the stochastic uses simple statistics to solve and display oversold or overbought price or yield activity. Financial asset prices, like those Olympic athletes in Paris, do get fatigued.
The chart below uses a bar graph to display the week’s high, low and close of the 10- year benchmark’ s yield, which are bordered by the Bollinger bands. Below that is the yield momentum followed by the stochastics displayed in the bottom panel.
Chart 1: First strike, New Zealand Government 10- year bond benchmark weekly yield high, low and close are displayed in the bar graphs; Bollinger bands upper, median and lower values are displayed in the line graphs.
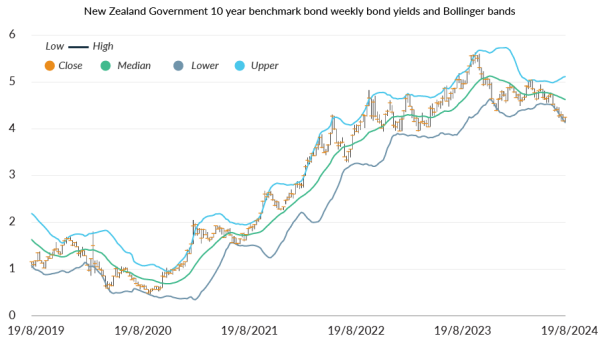
Reference data supplied by LSEG /Eikon. As at August 2024, observations and calculations are weekly data collected over a 5 year period.
Chart 2: Second strike, New Zealand Government 10- year bond benchmark yield momentum
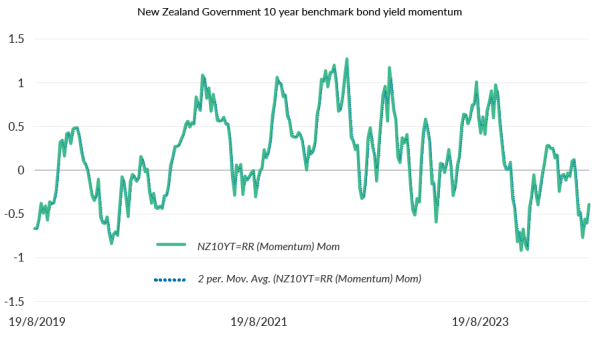
Reference data supplied by LSEG /Eikon. As at August 2024, observations and calculations are weekly data collected over a 5 year period.
Chart 3: Third strike, New Zealand Government 10- year bond benchmark yield stochastics
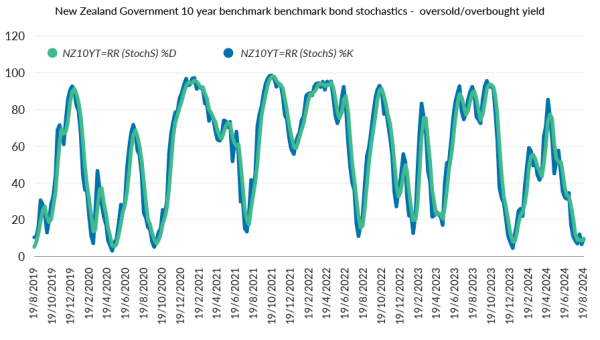
Reference data supplied by LSEG /Eikon. As at August 2024, calculations are weekly data collected over a 5 year period
What we’re looking for is confirmation of price or yield behaviour, patterns measured against historical data: all three metrics are deeply fatigued or in market parlance, overbought.
Reference data supplied by LSEG /Eikon. As at August 2024, observations and calculations are weekly data collected over a 5 year period.
Three strikes and you’re out?
As incongruous as it sounds, following so closely behind the dramatic easing in domestic monetary policy just announced by the regulator, we’re expecting that those investors with more hustle are of the view that the recent move lower in domestic fixed interest yields is overdone, or overbought. Consequently, we believe some are actively considering or actually transacting their where-to-next strategy.
To be clear, there is no guarantee that any decision to partially exit or greatly reduce an investment relative to the Bloomberg NZBond Composite 0+ Yr Index will be correct. The RBNZ could front load its OCR cuts quicker than current market forecasts or an unexpected geo-political event could ignite the demand for safe haven assets, such as Government bonds.
We also acknowledge that some investors may prefer to assess price action against other, more preferred metrics. Here we’re thinking about the deviation between discounted cash flow valuations versus equity prices or the assessment of foreign currency rates against long-run purchasing power parity (PPP) values. Regardless, the principals of statistical analysis are the same – how does the current price or yield action empirically compare against the observer’s preferred metrics?
We reckon, given the significant returns to-date and our assessment of the fatigued price action of the New Zealand Government 10- year bond yield, that some active investors won’t see enough of a risk-reward opportunity to continue with an overweight tactical asset allocation exposure to New Zealand fixed interest.
Additionally, in our view, the yield to maturity of the Bloomberg index – at around 4.30% - which we consider as a very rough starting point when assessing the future potential returns of a local core fixed interest strategy, - isn’t that compelling. Especially when compared to the potential return offered by alternative interest-rate sensitive asset classes.
It’s game-on for New Zealand fixed interest and we believe that any active investment manager should be well advanced in their where-to-next tactical asset allocation decision, ideally targeting an asset class that historically performs well once the easing cycle has actually begun.
Craig Alexander is Head of Fixed Interest and ESG at Octagon Asset Management